TL;DR: The best welcome offer isn't the one with the highest conversion rate — it's the one with the best net revenue per new subscriber. For most DTC brands, that means running the offer cost math on your specific AOV and margin before defaulting to a percentage discount. Often, a free shipping threshold or gift with purchase wins on net revenue even when a percentage discount wins on clicks.
Every week, a DTC founder logs into Klaviyo, sees a welcome popup conversion rate, and decides things are working. What they're not seeing is what that performance actually costs them — or whether a different offer would have produced a better result at lower margin erosion.
The welcome discount is one of the most expensive assumptions in DTC email marketing. Not because discounts are inherently bad. Because most brands set theirs once and never question it again. They copy a competitor's popup, land on results that vary by program off, and call it a strategy.
This article is about making the decision deliberately. We'll walk through the offer cost math, a brand archetype framework that tells you which offer type fits your category, and the right way to A/B test welcome offers in Klaviyo — which almost nobody is doing correctly. The welcome flow email sequence that delivers this offer matters too, but that starts with choosing the right offer in the first place.
What Does Your Welcome Offer Actually Cost You?
Most DTC brands evaluate welcome offers by conversion rate. That's the wrong metric. The right metric is net revenue per new subscriber — what you actually keep after the offer cost comes out of the transaction. A outcomes tied to your specific list discount might convert better than free shipping and still lose on net revenue.
Average order value (AOV) is the mean dollar amount customers spend per transaction, calculated by dividing total revenue by number of orders over a given period. Net revenue per subscriber is the average revenue generated per new email subscriber after offer costs are subtracted, calculated over a defined measurement window (typically 30 days).
Here's the math that makes this concrete. Consider two brand profiles:
Brand A: results that vary by program AOV, 55% gross margin. Gross profit on a healthy order is numbers that depend on your setup A performance that shifts with your audience welcome discount costs $4.50, leaving $20.25 gross profit on the first purchase. That's an competitive reduction in margin on the acquisition order.
Brand B: outcomes tied to your specific list AOV, 62% gross margin. Gross profit on a healthy order is results that vary by program A numbers that depend on your setup welcome discount costs $16.50, leaving $51.70 gross profit. That's a meaningful reduction — less painful in percentage terms, but performance that shifts with your audience in real dollars off every single acquired subscriber.
Gross margin is the revenue remaining after subtracting the cost of goods sold, expressed as a percentage of revenue. For a figures that differ across accounts product with $20.25 in COGS, gross margin is 55%.
Now run the same math on a free shipping threshold. If Brand B's average order already exceeds their shipping cost threshold, free shipping might cost outcomes tied to your specific list to fulfill versus $16.50 for the discount — and for customers who were already planning to buy, it removes friction without changing the purchase amount. The net revenue outcome can be meaningfully better even if the popup conversion rate is slightly lower.
This is the offer cost analysis that no listicle will run for you. Before you test anything, calculate your own numbers:
- Pull your actual average order value from Shopify
- Identify your gross margin percentage (or estimate it)
- Calculate the dollar cost of your current offer at current AOV
- Calculate gross profit per first purchase at that offer level
- Run the same calculation for a free shipping threshold and gift with purchase alternative
The output tells you your cost-per-acquired-subscriber by offer type before you spend a dollar on testing.
Key insight: Welcome flows typically generate $3–8 revenue per recipient according to Blossom's benchmark data — but that range assumes a reasonably efficient offer. Deep discounts at the wrong margin profile compress that number significantly on the first purchase, and the compounding effect over the subscriber's lifetime is worse than it looks.
Which Offer Type Fits Your Brand's Margin Profile?
There are four offer types worth considering for welcome popups: percentage discounts, free shipping thresholds, gift with purchase, and loyalty point bonuses. Each has a different cost to the brand, a different conversion profile, and a different fit by brand category. No one type wins universally — the right choice depends entirely on your margin structure and what kind of subscriber you want to attract.
A welcome popup is the on-site overlay that presents a subscriber incentive to new visitors in exchange for their email address, typically triggered by time-on-page, scroll depth, or exit intent. A/B testing is the practice of splitting traffic between two variants of a single element to measure which produces better outcomes on a defined success metric.
Percentage Discount
- Cost to brand: Direct margin erosion — typically results that vary by program of AOV, paid on every order
- Conversion profile: Highest popup submit rates according to Blossom's benchmark data (4–9% range depending on depth), but attracts a higher proportion of discount-motivated subscribers
- Best fit: Low-AOV consumables where volume matters and customers repurchase frequently; brands where the first order is a sample-size trial
- Watch out for: Training subscribers to expect discounts on every purchase; discount-conditioned subscribers have lower repeat purchase rates
Free Shipping Threshold
- Cost to brand: Actual shipping cost (typically numbers that depend on your setup for standard domestic), not a percentage of order — often meaningfully cheaper than a 15% discount on higher AOV orders
- Conversion profile: 3–5% popup submit rates based on Blossom's benchmark data; slightly lower than percentage discounts but attracts higher-intent subscribers who were planning to buy anyway
- Best fit: Brands with AOV above performance that shifts with your audience where shipping is a known purchase barrier; brands trying to reduce discount dependency
- Watch out for: Setting the threshold too high (customers don't try to hit it) or too low (you're giving away shipping on orders that didn't need the nudge)
Gift With Purchase
- Cost to brand: COGS of the gift item — often figures that differ across accounts for a sample or complementary product, versus $10–$18 for an equivalent percentage discount on a mid-AOV order
- Conversion profile: 4–7% popup submit rates from Blossom's benchmark data; particularly effective when the gift is a product the subscriber hasn't tried yet (cross-sell seeded in the acquisition)
- Best fit: Brands with natural product ecosystems (skincare, supplements, food) where the gift introduces a second SKU; premium brands that don't want to discount
- Watch out for: Choosing a gift that feels cheap or irrelevant; gift value needs to be legible in the popup
Loyalty Points Bonus
- Cost to brand: Redemption cost only (typically outcomes tied to your specific list of the points face value, not the full amount), making this the lowest-cost offer type for brands with loyalty programs
- Conversion profile: Lower popup submit rates than discounts — works best when the loyalty program is already established and the audience knows what points are worth
- Best fit: Brands with existing loyalty programs where subscribers already understand point value; repeat-purchase categories where building toward redemption is meaningful
- Watch out for: Points are meaningless to first-time visitors with no context — this offer requires a loyalty program to exist and be understood
This matrix exists because the vendor content that dominates this topic — written by companies selling promotional personalization software — recommends technology-layer solutions to what is fundamentally a strategy problem. The right offer type is determined by your margin profile and brand category, not by A/B testing software.
Get your free lifecycle audit — we'll analyze your current welcome offer, calculate what it's actually costing you per acquired subscriber, and show you which offer type your brand archetype calls for. Get your free welcome offer audit →
Which Offer Type Does Your Brand Archetype Call For?
DTC brands fall into four archetypes that each have a natural offer fit. Using the wrong offer type for your archetype doesn't just hurt margin — it actively undermines the positioning that makes your brand work. A premium skincare brand that opens with results that vary by program off is teaching customers that full price is negotiable before they've even experienced the product.
Archetype 1: Low-AOV Consumables (numbers that depend on your setup AOV, high repurchase frequency)
- Examples: Supplements, coffee, snacks, pet food, personal care basics
- Recommended offer: Percentage discount (performance that shifts with your audience) or free shipping threshold set slightly above AOV
- Rationale: The margin math tolerates a modest discount because the first purchase is the gateway to a high-frequency repurchase cycle. LTV compounds fast if you keep them. The goal is to lower the barrier to trial. Free shipping works when customers are ordering multiple items.
- Failure mode: Running figures that differ across accounts off when 10% would convert the same subscriber. Every point of unnecessary discount is pure margin loss across your entire acquisition volume.
Archetype 2: High-AOV Durables (outcomes tied to your specific list+ AOV, low repurchase frequency)
- Examples: Apparel, home goods, fitness equipment, furniture, electronics accessories
- Recommended offer: Free shipping threshold, gift with purchase, or early access/exclusivity
- Rationale: A results that vary by program discount on a $150 product is $22.50 off — real money that compounds painfully across subscriber volume. The purchase decision at this AOV is rarely driven by a popup offer anyway; customers need trust and information more than a discount. Free shipping removes a friction point without training discount expectations.
- Failure mode: numbers that depend on your setup off welcome discounts on $120+ products. You're not removing a purchase barrier — you're eroding your margins and setting a price anchoring problem for every future interaction. Customers who bought at performance that shifts with your audience off will hesitate at full price.
Archetype 3: Subscription-First Brands (subscription as the primary revenue model)
- Examples: Subscription boxes, supplement subscriptions, meal kits, recurring consumables
- Recommended offer: First-order discount structured as a subscription trial, or a gift with purchase that seeds ongoing usage
- Rationale: The unit economics of subscription brands make first-order margin less critical than subscriber LTV. A deeper first-order discount is defensible if subscriber retention is strong. The offer should be framed around the subscription value proposition, not a one-time deal.
- Failure mode: Welcome discounts that attract one-time buyers who churn immediately. Track subscriber-to-subscriber retention, not just conversion rate.
Archetype 4: Premium / Brand-Positioning Brands (brand equity is the primary differentiator)
- Examples: Premium skincare, luxury apparel, artisan food, high-end wellness
- Recommended offer: Non-monetary offers first — early access, editorial content, founder story, exclusive community membership, or quiz-based personalization (zero-party data exchange)
- Rationale: Discounting signals value equivalence. If a figures that differ across accounts face serum leads with "15% off," you have immediately taught the customer that your price is soft. According to research published by Harvard Business Review, premium brands that lead with discounts see measurable long-term erosion in perceived product quality and willingness to pay full price on subsequent purchases.
- Failure mode: Defaulting to a percentage discount because it's easy to set up and benchmark data shows high submit rates. Submit rate is not your goal — subscriber quality and lifetime value are.
How Should You A/B Test Your Welcome Offer in Klaviyo?
Klaviyo is an email and SMS marketing platform widely used by DTC ecommerce brands to build automated flows, segment subscribers, and measure revenue attribution. Most brands that claim to be A/B testing their welcome offer are testing the wrong thing at the wrong layer — and measuring the wrong outcome.
Here is the core mistake: if you test two subject lines in your welcome email to see which offer converts better, you're not testing the offer — you're testing subject line appeal on subscribers who already saw and accepted the offer. The offer decision happened at the popup. To actually test offer performance, you need to show different offers to different popup visitors before they subscribe.
How to Set Up a Welcome Offer A/B Test Correctly
- Configure the test at the popup level. Use your popup platform (Privy, Justuno, or whatever you're running on your Shopify store) to create two popup variants with different offers. Variant A might be outcomes tied to your specific list off; Variant B might be free shipping over $75. Set traffic split to 50/50.
- Sync offer codes between your popup platform and Klaviyo. Each popup variant needs a distinct offer code that flows automatically into your Klaviyo welcome sequence. Variant A subscribers should receive the results that vary by program off code in their welcome email; Variant B subscribers should receive the free shipping code. If these codes get mismatched — a common error — your test data is garbage.
- Tag subscribers by variant in Klaviyo. Use custom profile properties or source lists to tag each subscriber with which offer they received. This lets you analyze downstream performance by cohort.
- Define your measurement window. Track subscriber behavior for 30 days from signup. This captures first purchase, not just immediate conversion.
- Calculate net revenue per new subscriber for each variant. Total revenue from Variant A subscribers minus total offer cost, divided by total Variant A subscribers. Same calculation for Variant B. The higher net revenue per subscriber wins — regardless of which variant had a higher popup submit rate.
On sample size: For a brand generating 500–2,000 new subscribers per month, a 30-day test at 50/50 split gives you 250–1,000 subscribers per variant. That's enough to see directional signal on net revenue per subscriber, but be cautious about calling a winner until you see at least 200 first purchases across both variants combined. Smaller brands may need 45–60 days.
What not to measure: Popup submit rate as the winner metric. A free shipping offer may submit at numbers that depend on your setup versus 6% for a percentage discount. If free shipping produces higher net revenue per subscriber, it wins — even though it captured fewer total emails. You're optimizing for revenue, not list size.
For additional technical guidance on Klaviyo flow configuration and testing methodology, the official Klaviyo flow A/B testing documentation covers how to structure variant splits and track performance at the flow level.
Is Your Current Welcome Discount Compounding Against You Over Time?
The real cost of a default welcome discount isn't just the margin on the first order. In our experience working across DTC programs, subscribers acquired with deep discounts tend to repurchase at lower rates, show higher price sensitivity on future orders, and produce meaningfully lower lifetime value than subscribers acquired with non-monetary or lower-discount offers. You're not just losing margin on day one — you're likely selecting for a lower-quality customer.
This pattern shows up consistently in programs where welcome discounts are deep (performance that shifts with your audience+) and the brand hasn't measured subscriber cohort quality by acquisition offer. The first-purchase metrics look fine — conversion rate is good, revenue per subscriber looks reasonable. The problem is invisible until you look at 90-day repeat purchase rates by acquisition cohort.
Subscribers who joined for a figures that differ across accounts discount are more likely to wait for the next campaign discount before repurchasing. They've been trained that your price is negotiable. Subscribers who joined for a free shipping offer or gift with purchase have a different mental model of the brand — they're more likely to pay full price on a second order.
The practical test: segment your subscriber base by the offer type they received at acquisition and compare 90-day repeat purchase rates and AOV across cohorts. If you've been running the same offer for 12+ months, you may not have variation to test this against — which is itself a reason to run the test described in the previous section.
Across the programs we've audited, brands with heavily discount-conditioned subscriber bases also tend to see elevated cart abandonment rates — those subscribers have learned to wait for a code before completing checkout, which makes abandonment recovery flows harder and more expensive to run.
The cart abandonment flow is the next revenue lever after welcome offer optimization — and notably, brands with discount-conditioned subscribers see higher cart abandonment rates because those subscribers are waiting for a code before completing checkout.
Want us to build your welcome offer testing framework inside Klaviyo? Book a free strategy call — we'll map out your offer strategy, testing plan, and expected revenue impact. Book your free strategy call →
Key Takeaways
- The right welcome offer is determined by your brand archetype and margin profile, not by what your competitors do or what converts at the highest rate in isolation
- Free shipping thresholds often match or outperform percentage discounts in net revenue per subscriber, especially for brands with AOVs above outcomes tied to your specific list — but only when the threshold is set slightly above current AOV
- Most brands A/B test welcome offers incorrectly: they test at the email level when the offer is set at the popup level, and they optimize for conversion rate when they should be optimizing for net revenue per new subscriber
- The discount trap compounds over time: subscribers acquired with deep discounts tend to show lower repeat purchase rates and higher price sensitivity — you're not just losing margin on the first order
- Premium and brand-positioning DTC brands should default to non-monetary welcome offers (early access, editorial content, zero-party data exchange) before testing discounts — discounting signals value equivalence that undermines premium positioning
Frequently Asked Questions
What is a good welcome offer for an ecommerce store?
The best welcome offer depends on your brand archetype and margin profile, not a universal benchmark. Low-AOV consumable brands typically do well with 10–15% off or a free shipping threshold. High-AOV durable brands are better served by free shipping or gift with purchase. Premium brands should test non-monetary offers (early access, personalization quiz) before discounting. The right question isn't "what's a good offer" — it's "what does my margin math support, and what type of subscriber do I want to acquire?"
Should I offer a discount to new email subscribers?
Not automatically. Percentage discounts have the highest popup conversion rates, but they also attract the most price-sensitive subscribers and produce the lowest repeat purchase rates over time. If your gross margin is above 55% and AOV is above $80, a free shipping threshold or gift with purchase will often produce better net revenue per subscriber than a 15% discount — and acquire a subscriber less conditioned to expect discounts on future purchases. Run the offer cost math on your specific numbers before defaulting to a discount.
What is the average conversion rate for a welcome popup offer?
Popup conversion rates vary significantly by offer type and traffic quality. Based on Blossom's benchmark data, percentage discounts typically drive 4–9% submit rates, free shipping offers drive 3–5%, and gift with purchase offers drive 4–7%. However, submit rate is the wrong optimization target for offer testing. A popup that converts at 5% but produces $6.80 in net revenue per subscriber beats one that converts at 8% but produces $4.20 in net revenue per subscriber. Optimize for the revenue metric, not the submit rate.
Does a free shipping offer convert better than a percentage discount?
Free shipping typically converts at a lower popup submit rate than a percentage discount — but it frequently wins on net revenue per subscriber because its cost to the brand is fixed (actual shipping cost) rather than a percentage of order value. On a $100 AOV order with 60% gross margin, a 15% discount costs $15 in margin; free shipping tends to cost meaningfully less in actual fulfillment depending on your carrier rates and packaging. If both offers drive similar downstream conversion rates from subscriber to first purchase, free shipping wins on net revenue. The only way to know for your specific brand is to run the test correctly at the popup layer.
How do I A/B test my welcome popup offer?
Configure the test at the popup platform level (Privy, Justuno, or equivalent) with 50/50 traffic split to different offer variants. Assign distinct discount codes to each variant and ensure those codes flow correctly into your Klaviyo welcome sequence — mismatched codes are the most common failure point. Tag subscribers by variant using custom Klaviyo profile properties. Measure net revenue per new subscriber over 30 days for each cohort, not popup submit rate or email open rate. Call a winner only after seeing sufficient first-purchase volume across both variants — typically 200+ purchases combined for brands in the 500–2,000 subscriber/month range.
Get tactics like this in your inbox every week. Subscribe to our retention marketing newsletter →
Need help implementing this?
Let us take the hassle of managing your email marketing channel off your hands. Book a strategy call with our team today and see how we can scale your revenue, customer retention, and lifetime value with tailored strategies. Click here to get started.
Curious about how your Klaviyo is performing?
We’ll audit your account for free. Discover hidden opportunities to boost your revenue, and find out what you’re doing right and what could be done better. Click here to claim your free Klaviyo audit.
Want to see how we’ve helped brands just like yours scale?
Check out our case studies and see the impact for yourself. Click here to explore.

Read Our Other Blogs

How to Build an Email Campaign Calendar Without Discounting


Browse Abandonment Flow: Converting Window Shoppers Into Buyers

The Abandoned Cart Email Strategy That Actually Recovers Revenue

Klaviyo vs Attentive: Which Platform Is Right for Your DTC Stack in 2026

Migrating to Klaviyo: The Step-by-Step Playbook for Switching ESPs Without Losing Revenue

Browse Abandonment Flow: The Underbuilt Sequence Quietly Leaking Revenue

Post-Purchase SMS Flow: How to Use Text Messages to Build Loyalty After the First Order

Retention Marketing Dashboard: The Exact Metrics and Reports You Should Be Reviewing Weekly

Agency vs In-House Email Marketing: What Actually Moves the Needle for DTC Brands

SMS Marketing Strategy for Ecommerce: The Complete Guide

How to Set Up Klaviyo Flows: Complete Setup Guide

A/B Testing for Email: What to Test, How to Measure, When to Ship

Email Marketing KPIs: The Only Metrics That Matter for DTC

Email Revenue Attribution: What Klaviyo Gets Right and Wrong

Popup Strategy for Ecommerce: 6 Types That Actually Convert

RFM Analysis for Ecommerce: Segment Your Customers by Value

Email Segmentation for Ecommerce: The 5-Layer Model for DTC Brands

Email Warmup Strategy: How to Build Sender Reputation From Scratch

Email List Hygiene: How to Clean Your List Without Killing Revenue

SPF, DKIM, and DMARC: Email Authentication Explained for DTC Brands

The Complete Retention Marketing Strategy Guide (2026)

Winback Flow: How to Re-Engage Lapsed Customers Before You Lose Them

How to Audit Your Email Flows (The 125-Point Checklist)

Post-Purchase Email Flow: The Architecture That Drives Repeat Buyers

Sunset Flow: When and How to Remove Unengaged Subscribers

Cart Abandonment Flow: How to Recover Revenue Without Discounting

How to Build a Welcome Flow That Actually Converts
How to Build an Email Campaign Calendar Without Discounting
Browse Abandonment Flow: Converting Window Shoppers Into Buyers
The Abandoned Cart Email Strategy That Actually Recovers Revenue

How to Build a Welcome Flow That Actually Converts

Personalizing Push Notifications for Better Retention Outcomes
How to Craft Email Newsletters That Build Real Brand Loyalty
Top 3 Best eCommerce Content Management Systems of 2025
Email Marketing vs. Social Media: Which One Should Your Brand Focus On?

Attract More Customers: Which Videos to Use in Your Email Marketing and Why
8 eCommerce Customer Service Mistakes You NEED to Stop Making (Like, Yesterday)
Creating The Perfect E-Commerce Tech Stack

Types of Content eCommerce Brands Need in Their Marketing Mix
Ecommerce Email Mistakes: Blossom Ecom Article on How to Stop Sending Bad Emails & Start Making More Money
Boost Your Bottom Line: The Ultimate Guide to Integrating Website and Email Strategies for Your eCommerce Business
6 Powerful Ecommerce Loyalty Program Examples (and How to Build Your Own)
Loyalty-First Guide to Customer Reactivation Email Campaigns
Using Email Marketing to Supercharge Your Loyalty Program
Unpacking Brand and Conversion in E-Commerce Design
13 Scary E-Commerce Mistakes (and How to Avoid Them)
How to Reduce Your E-Commerce Bounce Rate and Boost Engagement
Combining Content and Commerce for E-Commerce Success

Email Marketing Tips + Trends

E-Commerce Returns Analysis & Crafting a Profitable Returns Policy

9 Pro Tips for A/B Testing Emails with HubSpot

AI and Email Marketing: The Future is Here
How to Skyrocket Your Email Open Rates and Click-Through Rates
Email Isn’t Dead: 4 Reasons It’s Still a Digital Marketing Powerhouse

Email Marketing Series – #3: Building a Strong Email List
Email Marketing Series – #4: 9 Tips for Creating High-Impact Email CTAs

Email Marketing Series – #2: How to Craft Attention-Grabbing Subject Lines

Email Marketing vs. Social Media Marketing — Which Should I Use?
Email Marketing Series – #1: Crafting an Effective Email Marketing Strategy
Email Open Rate: A Practical Guide
3 Effective Strategies to Make Email Your Marketing Heavyweight Champion

How to Attract New Leads with Video in Your Email Marketing
How to Determine the Profitability of Your eCommerce Website
Multi-Channel eCommerce: The Key to Growing Your Online Business
Understanding eCommerce Conversion Rate & Optimization
How to Optimize Your eCommerce Website for More Conversions
Top 3 eCommerce and Digital Marketing Trends for 2025

Optimizing Your Email Marketing Strategy: A/B Testing Explained
35 Eye-Opening Email Marketing Stats You Need to Know
7 Email Marketing Tips to Boost Your SEO
11 Common Email Marketing Mistakes That Are Tanking Your Conversions (And How to Fix Them)
Strategic SEO Tips for Email Marketing: Boost Engagement and ROI
How to Measure and Increase Email Marketing ROI (Plus Templates That Convert!)

Do Lifecycle Email Campaigns Really Drive Conversions? Here’s What We Found
How to Use Remailing in Your Email Marketing Strategy

B2B Email Marketing: Building Relationships and Converting Leads
Core Email Marketing Flows: 2025 Essentials for Shopify

Top 5 Revenue-Generating Email Marketing Journeys (Straight from a Klaviyo Partner Agency)
The Long and the Short of It: Getting to “Yes” with Email Marketing
10 Email Marketing KPIs Every Marketer Needs to Know
3 Steps to Spring Clean Your Email Marketing Platform

How to Use Artificial Intelligence (AI) in Email Marketing in 2024

How To Create Marketing Emails That Engage Your Audience and Get Results

Why SMS is the Perfect Addition to Any Marketing Mix
Why Personalization is Critical for eCommerce Growth

How to Grow Your Startup’s Email List: Lessons from Daycation

How We Achieved a 27% Winback Rate with a Smart Email Strategy for Dumpling

The Hidden Pitfalls of Email Marketing: Blacklists and Spam Traps
The iOS18 Mail Update: What Marketers Need to Know

Supercharging Customer Journey Automations with Email Touchpoints
Why Your Abandoned Cart Series Needs More Than One Email
13 Simple Design Hacks Using Klaviyo Email Marketing & Shopify
5 Simple Tactics to Grow Your Klaviyo SMS List Without Overcomplicating Things

Why Klaviyo SMS Crushes Other SMS Providers (And How Ignoring It Costs You Revenue)

10 Klaviyo Strategies That Drove Over $50 Million for Our Clients
Email Marketing Management for eCommerce: A Real Guide
Email Marketing 101: How to Create Emails That Convert
Shopify Email Marketing: Campaigns + Automations That Actually Grow Sales
7 eCommerce Trends to Watch in 2025
The Complete Guide to Winning at B2B eCommerce in 2025
Answering YOUR Email Marketing Questions

What Is Email Marketing and Why Does It Work So Well?
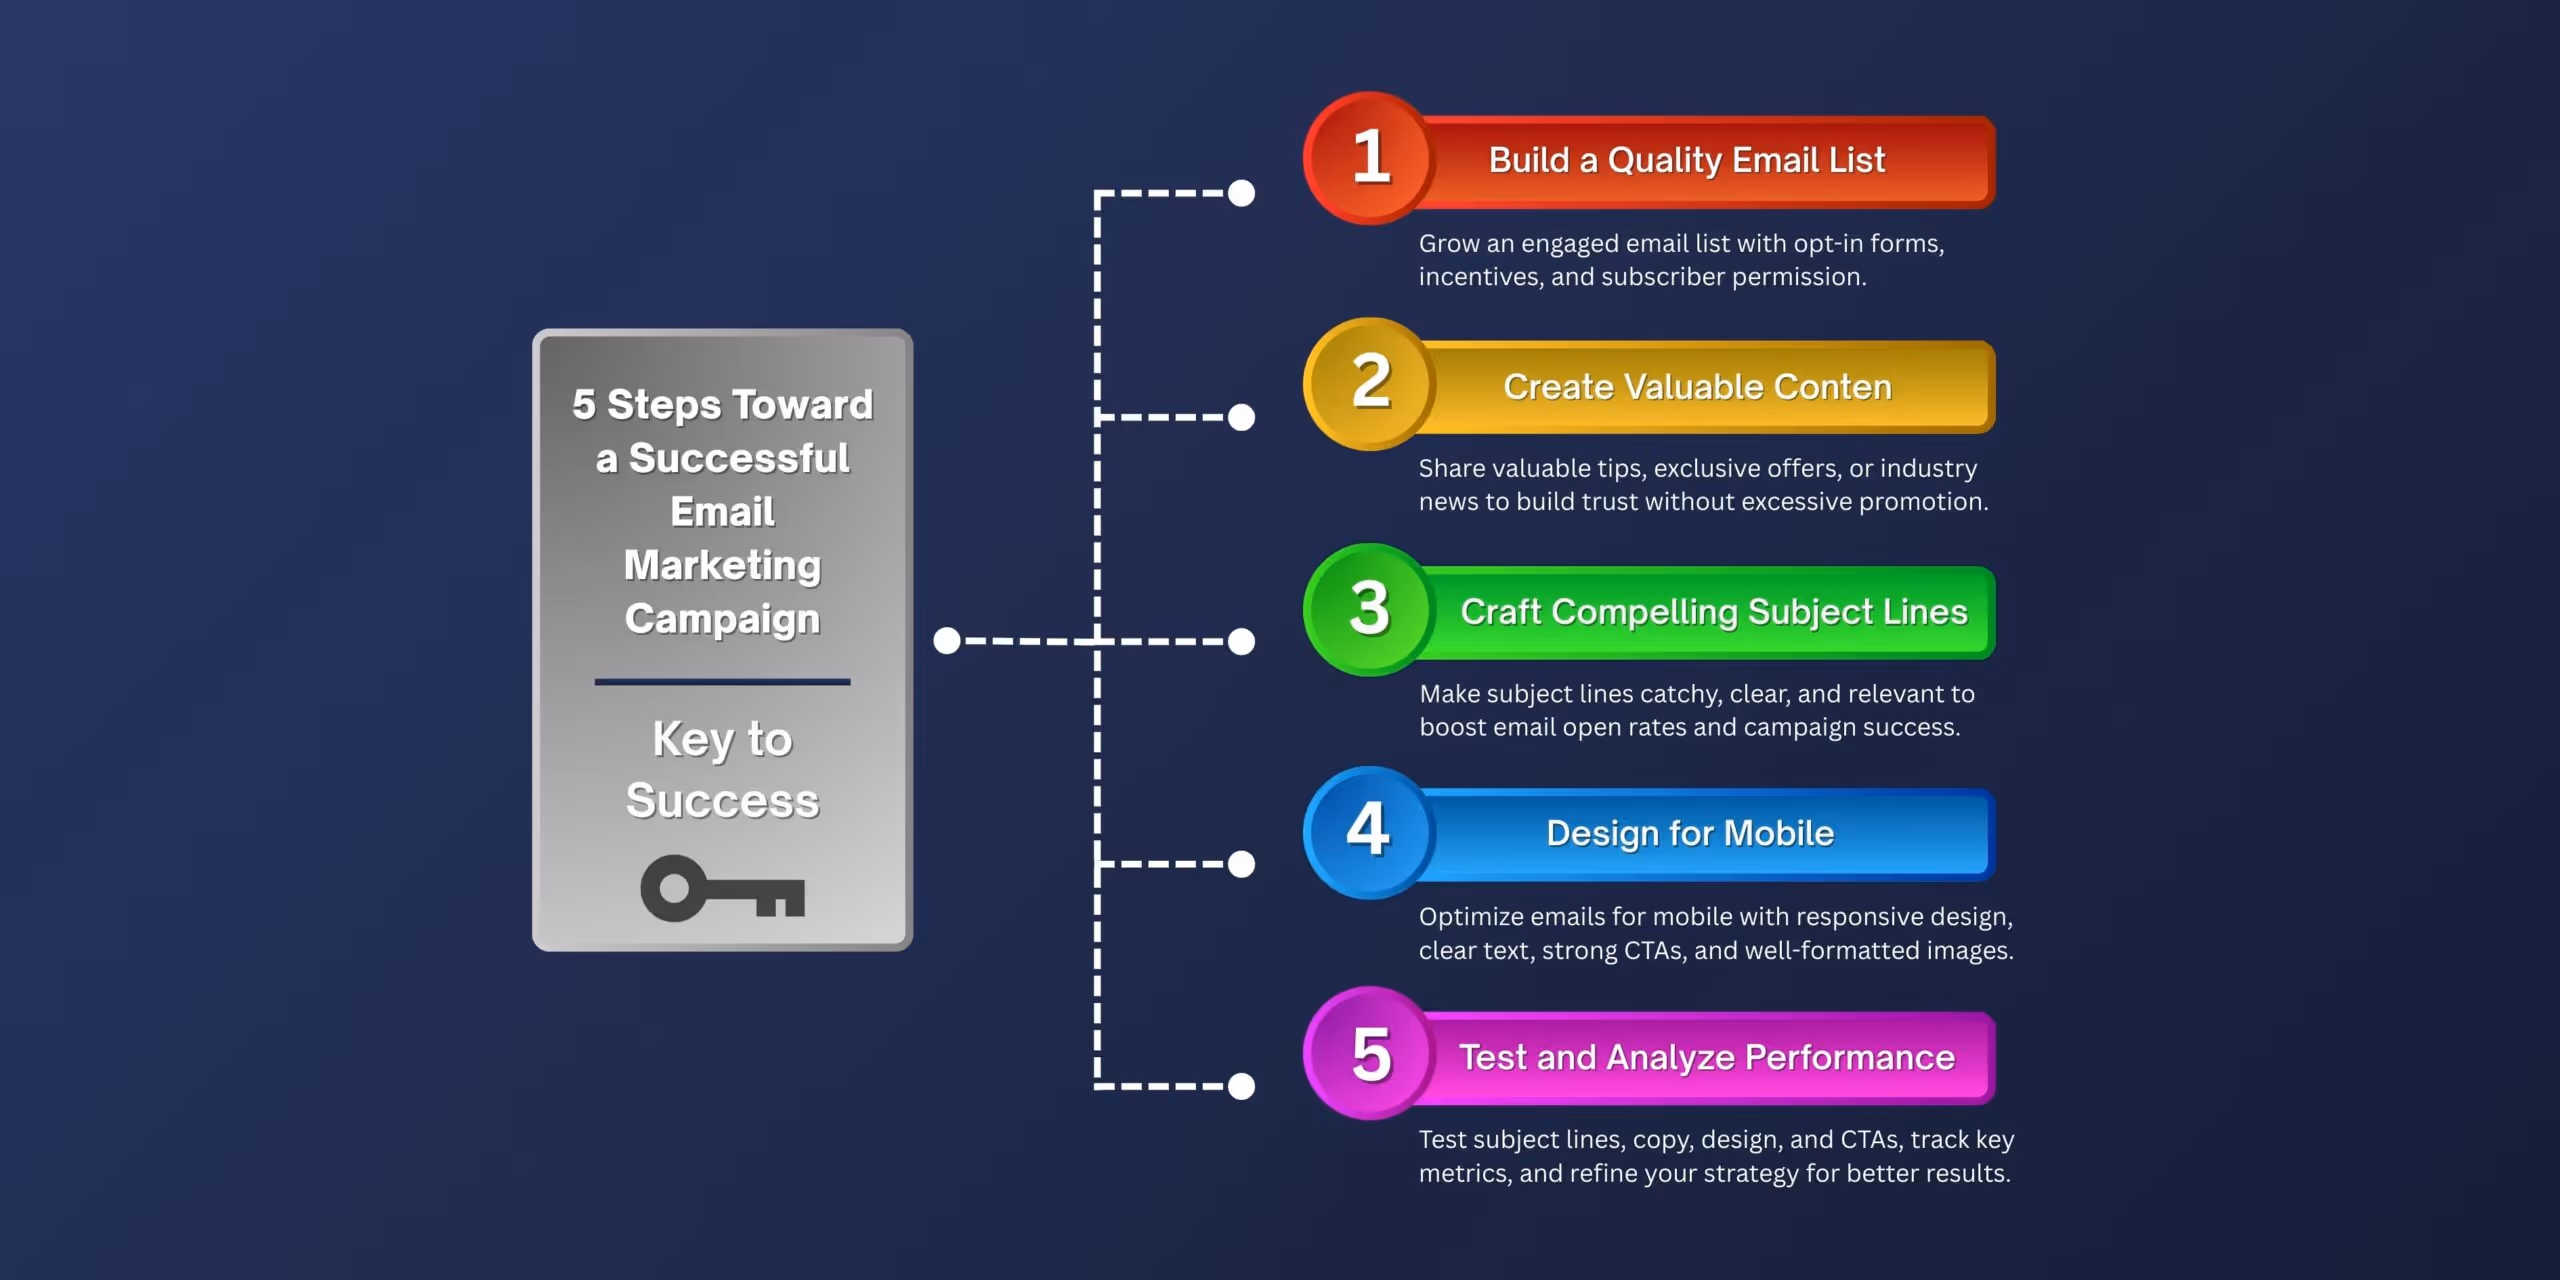
5 Steps Toward a Successful Email Marketing Campaign


Not Sure Where to Start?
Let's find the biggest retention opportunities in your business. Get a free Klaviyo audit or retention consultation.